require(dplyr)
require(tidyr)
require(plotly)Image credits: MEI index at NOAA
Required R packages: Paquetes de R necesarios:
ICEN (Índice Costero El Niño/EL Niño Coastal Index)
Reference: https://siofen.imarpe.gob.pe/nivel2/indice-costero-el-nino-icen
NoteR
icen <- read.table(
  file = "http://met.igp.gob.pe/datos/ICEN.txt",
  skip = 5,
  header = FALSE
) |>

  as_tibble() |>

  rename(año = V1, mes = V2, ICEN = V3) |>

  mutate(
    date = paste(año, mes, 1, sep = "-") |> as.Date(),
    ICEN_c = cut(
      x = ICEN,
      breaks = c(-Inf, -1.3, -1.1, -.7, .5, 1.3, 2.1, 3.5, Inf),
      labels = c(
        "Niña Fuerte", "Niña Moderada", "Niña Débil",
        "Neutro",
        "Niño Débil", "Niño Moderado", "Niño Fuerte", "Niño Extraordinario"
      )
    )
  )
NoteData
PDO (Pacific Decadal Oscillation)
Reference: https://www.ncei.noaa.gov/access/monitoring/pdo/
NoteR
pdo <- read.table(
  file = "https://www.ncei.noaa.gov/pub/data/cmb/ersst/v5/v6/index/ersst.v6.pdo.dat",
  skip = 1, header = TRUE
) |>

  as_tibble() |>

  pivot_longer(
    cols = -Year,
    names_to = "mes",
    values_to = "PDO"
  ) |>

  rename(año = Year) |>

  mutate(
    mes = seq(12)[match(x = mes, month.abb)],
    date = paste(año, mes, 1, sep = "-") |> as.Date(),
    PDO_c = cut(
      x = PDO,
      breaks = c(-Inf, 0, Inf),
      labels = c("Frío", "Cálido")
    )
  ) |>

  filter(PDO < 99)
NoteData
TPI (Tripole Index for the Interdecadal Pacific Oscillation)
Reference: https://psl.noaa.gov/data/timeseries/IPOTPI/
NoteR
tpiURL <- "https://psl.noaa.gov/data/timeseries/IPOTPI/tpi.timeseries.ersstv5.data"

yrsRange <- read.table(
  file = tpiURL,
  header = FALSE, nrow = 1
) |> as.numeric()

tpi <- read.table(
  file = tpiURL,
  skip = 1,
  header = FALSE,
  nrow = diff(yrsRange) + 1
) |>

  as_tibble() |>

  pivot_longer(
    cols = -V1,
    names_to = "mes",
    values_to = "TPI"
  ) |>

  rename(año = V1) |>

  mutate(
    mes = gsub(x = mes, pattern = "V", replacement = "") |> as.numeric(),
    mes = mes - 1,
    date = paste(año, mes, 1, sep = "-") |> as.Date(),
    TPI_c = cut(
      x = TPI,
      breaks = c(-Inf, 0, Inf),
      labels = c("Frío", "Cálido")
    )
  ) |>

  filter(TPI > -99)
NoteData
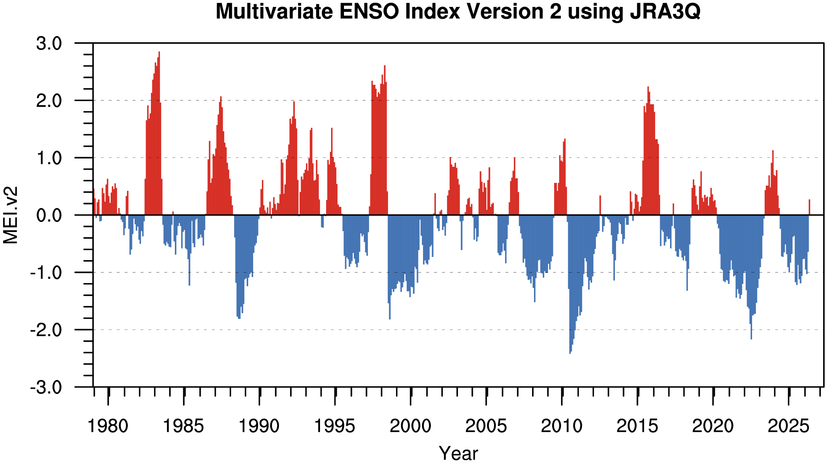
MEI (Multivariate ENSO Index v2)
Reference: https://psl.noaa.gov/enso/mei/
NoteR
meiURL <- "https://psl.noaa.gov/enso/mei/data/meiv2.data"

yrsRange <- read.table(file = meiURL, header = FALSE, nrow = 1) |>

  as.numeric()

mei <- read.table(
  file = meiURL,
  skip = 1,
  header = FALSE,
  nrow = diff(yrsRange) + 1
) |>

  as_tibble() |>

  pivot_longer(
    cols = -V1,
    names_to = "mes",
    values_to = "MEI"
  ) |>

  rename(año = V1) |>

  mutate(
    mes = gsub(x = mes, pattern = "V", replacement = "") |> as.numeric(),
    mes = mes - 1,
    date = paste(año, mes, 1, sep = "-") |> as.Date(),
    MEI_c = cut(
      x = MEI,
      breaks = c(-Inf, 0, Inf),
      labels = c("Frío", "Cálido")
    )
  ) |>

  filter(MEI > -999)
NoteData